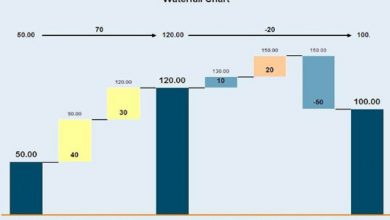
Waterfall chart
-
Finance

What is a Waterfall Graph?
A waterfall chart is a type of graph that is used to show how a value progresses from one phase…
Read More »

A waterfall chart is a type of graph that is used to show how a value progresses from one phase…
Read More »